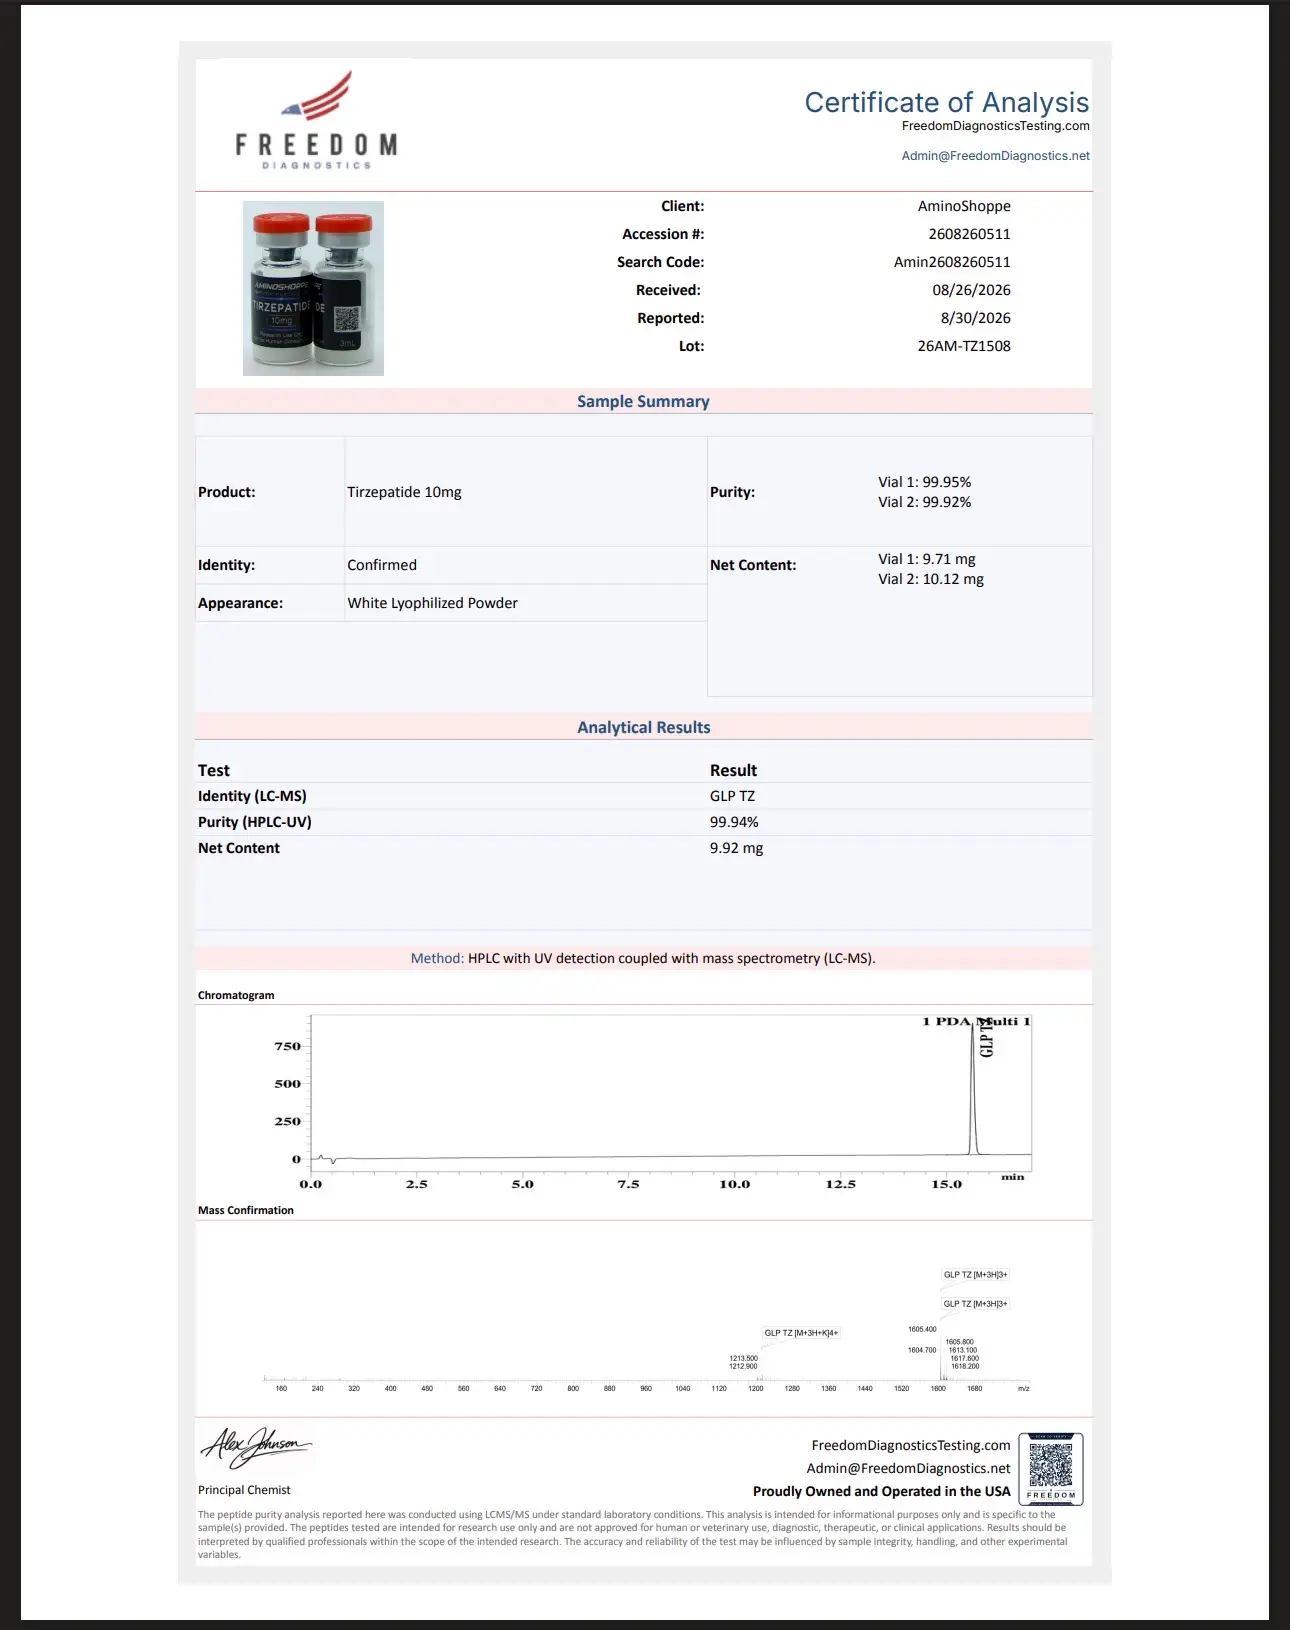
A chromatogram can look clean and still leave material questions unanswered. For research buyers, reading peptide HPLC chromatograms means assessing more than whether one peak is taller than the rest. The chromatogram must be read alongside the method, detector conditions, integration settings, sample preparation, and supporting certificate of analysis. It is a quality-control document, not a standalone guarantee of identity, concentration, or suitability for a specific experiment.
All materials discussed here are intended for laboratory research use only. They are not for human or animal consumption.
What a Peptide HPLC Chromatogram Shows
High-performance liquid chromatography separates components in a prepared sample as they travel through a column under defined solvent conditions. A detector records the compounds as they elute. The resulting plot typically places time on the x-axis and detector response, commonly UV absorbance, on the y-axis.
For peptides, reversed-phase HPLC is common. The analyte interacts with a nonpolar stationary phase and elutes as the mobile-phase composition changes, often through an acetonitrile-water gradient containing an acidic modifier. More retained components generally emerge later under a given method, but retention time is method-specific. It should not be treated as a universal peptide identifier.
A chromatogram can help a researcher evaluate whether the tested sample appears to contain one dominant UV-active component and whether detectable secondary components are present under the reported method. It does not, by itself, establish molecular identity. Mass spectrometry, sequence confirmation, and other orthogonal methods address different questions.
Start With the Method, Not the Peak
A purity percentage has little meaning without the conditions used to generate it. Before assessing the trace, review the analytical method listed on the certificate of analysis or laboratory report. At minimum, a usable record should identify the column or stationary phase, mobile phases, gradient, flow rate, detection wavelength, injection amount or concentration, and retention time.
These details determine what the separation can reveal. A short, fast gradient may be appropriate for routine screening, but it may not resolve closely related deletion sequences, oxidation products, diastereomers, or synthesis byproducts as effectively as a slower, optimized method. A single UV wavelength also favors compounds that absorb strongly at that wavelength. Impurities with weak UV response may be underrepresented.
The practical question is not whether a number is high in isolation. It is whether the method has enough resolving power to support the claim being made. For a research program that depends on distinguishing closely related peptide species, method transparency matters as much as the reported area percentage.
Retention Time Is a Reference Point
Retention time is the time between injection and the apex of a peak. On a properly documented report, the main peak should have a defined retention time. This helps establish consistency between lots tested under the same conditions.
It does not prove identity across different laboratories, columns, gradients, or instruments. Even modest changes in column age, temperature, solvent composition, pH, dwell volume, and gradient timing can shift retention. Compare retention times only when the method is materially equivalent.
For procurement review, a reported retention time is most useful when paired with a chromatogram from the same method and lot-specific documentation. A supplier should not rely on a generic trace to represent every production lot.
How to Read the Main Peak
The dominant peak is usually the first item researchers inspect. Its area, shape, retention time, and separation from neighboring peaks each carry information.
A symmetrical, well-resolved main peak generally supports a cleaner interpretation than a broad or distorted peak. Peak tailing can arise from secondary interactions, column condition, injection solvent mismatch, overload, or sample-related effects. Fronting may indicate excessive loading or other method issues. Neither shape alone establishes a product defect, but both deserve context when purity is being evaluated.
Look closely at the baseline around the principal peak. A visible shoulder can indicate partial co-elution, where two components are not fully separated. Small adjacent peaks may represent related substances, residual synthesis intermediates, degradation products, or contaminants. Their identity cannot be assigned from UV-HPLC alone, but their presence should not be ignored simply because the integrated main-peak area remains high.
Baseline separation is the clearest outcome. When adjacent peaks return to a stable baseline between them, integration is typically more defensible. When peaks overlap, reported percentages depend heavily on the integration approach and may not reflect the true proportion of each component.
Peak Area Is Not the Same as Absolute Purity
Most peptide HPLC reports express purity as area percent: the integrated area of the main peak divided by the total integrated area of included peaks. This is useful as a routine analytical metric, but it is not equivalent to absolute mass purity.
UV response varies between compounds. Two components present at identical mass concentrations can produce different peak areas because their chromophores and extinction characteristics differ at the selected wavelength. In addition, material that does not elute within the method window, does not absorb appreciably at the monitoring wavelength, or is excluded by integration parameters may not appear in the calculated total.
For this reason, an area-percent result should be described accurately as HPLC area purity under the stated analytical conditions. It should not be extended into claims about biological activity, dosage, sterility, endotoxin status, or fitness for any use outside controlled laboratory research.
Integration Settings Can Change the Result
Integration converts a detector signal into reported peak areas. Baseline placement, peak-width settings, slope sensitivity, threshold values, and manual adjustments all affect the final calculation.
A credible report should show a trace where the integrated peaks and baseline are visible or otherwise clearly described. Be cautious when a certificate presents only a purity percentage without the underlying chromatogram, method, test date, or lot number. The absence of that context prevents meaningful review.
Very small peaks can be real, analytical noise, solvent artifacts, or carryover. A blank injection and system-suitability information help distinguish those possibilities, though these are not always included in a customer-facing COA. For critical research applications, request documentation appropriate to the work rather than assuming a single chromatogram answers every analytical question.
Common Patterns That Merit Review
Chromatograms are best read as patterns, not pass-fail graphics. The following observations commonly justify closer review:
- A main peak with a shoulder or unresolved neighboring signal.
- Large baseline drift during the gradient, especially near late-eluting peaks.
- Unexpected peaks near the solvent front or at the end of the run.
- A broad, split, heavily tailing, or fronting principal peak.
- A reported percentage without a lot-specific chromatogram and method details.
None of these features automatically invalidates a material. For example, baseline movement can occur during gradient elution, and early signals can result from injection solvents or non-retained components. The appropriate response is to examine the method, lot record, and any orthogonal analytical results, not to assign an impurity identity by appearance alone.
Reading Peptide HPLC Chromatograms With a COA
A certificate of analysis is most useful when its records agree with one another. Confirm that the lot or batch identifier on the chromatogram matches the lot being reviewed. Check that the analyte name, test date, reported purity, retention time, and method designation are internally consistent.
Then separate the questions being answered. HPLC addresses chromatographic composition under defined conditions. Mass spectrometry supports molecular-mass confirmation. Water content, residual solvents, counterion content, and net peptide content may require separate assays. Microbiological testing, endotoxin testing, and sterility testing are distinct analyses and should never be inferred from an HPLC trace.
This distinction matters particularly for lyophilized peptide material. A high HPLC area percentage does not state how much peptide is present by weight in a vial, nor does it account for salts, water, or other non-UV-active components. Research planning should use the documentation that corresponds to the parameter under evaluation.
A Practical Review Standard for Research Procurement
When reviewing peptide documentation before a purchase or before introducing a lot into a study, use a consistent standard. Verify that the chromatogram is legible, lot-specific, and accompanied by defined test conditions. Confirm that the principal peak is integrated clearly and assess whether nearby signals are resolved. Treat the listed purity as method-dependent area percentage unless the report explicitly states otherwise.
For work where trace related substances could alter interpretation, consider whether the available method is sufficiently discriminating. A general purity trace may be adequate for preliminary research, while analytical development, comparative work, or sensitive mechanistic studies may require additional characterization. The appropriate threshold depends on the assay, the compound, and the consequences of an unresolved impurity.
At AMINOSHOPPE, documentation should be evaluated as part of a controlled research-material review process, alongside lot identification and stated research-use-only handling requirements. A clean chromatogram is valuable evidence when it is traceable, method-supported, and interpreted within its limits.
The most useful habit is simple: do not ask a chromatogram to answer questions it was not designed to answer. Read the peak, read the method, and keep every quality decision tied to the specific lot and the demands of the research.
Related Posts

BPC 157 Research Peptide Buying Criteria
A BPC 157 research peptide should be evaluated as a…

COA Documentation vs Purity Report Explained
A high reported purity percentage can look decisive on a…

How to Choose Research Compounds Online Safely
A product page can look credible while leaving the questions…